With the 360 degree feedback the answers are based on respondent groups (Others, Employee himself, Managers, Peers, Subordinates or Colleagues and Clients or Partners). Also, there is an average for every respondent group. If applicable, the result of a previous similar survey is demonstrated (light grey line).
In regards to the performance appraisals one
form is compared to the company’s general results and the employee’s unit and if
possible with the job family. This sort of statistics assume scalar questions
have been used in the form.

The calibration tool can be used hand in
hand with the performance appraisals. This is only usable if 2D evaluation was
used in the performance appraisal form. Only users with manager and HR manager
rights can use this function to calibrate evaluations of managers.

An internal statistics comparison engine is
built in the system which enables choosing a specific form and compare results
based on departments or job families. This function is available to HR managers
or managers only for the departments under their management.

The statistics needs differ in bigger
organizations. It is possible to download all the data in Excel format. Based
on the spreadsheets our clients or consultants prepare more detailed analyses
which provide answers to important business challenges. Below are some examples
of how we present the statistics.

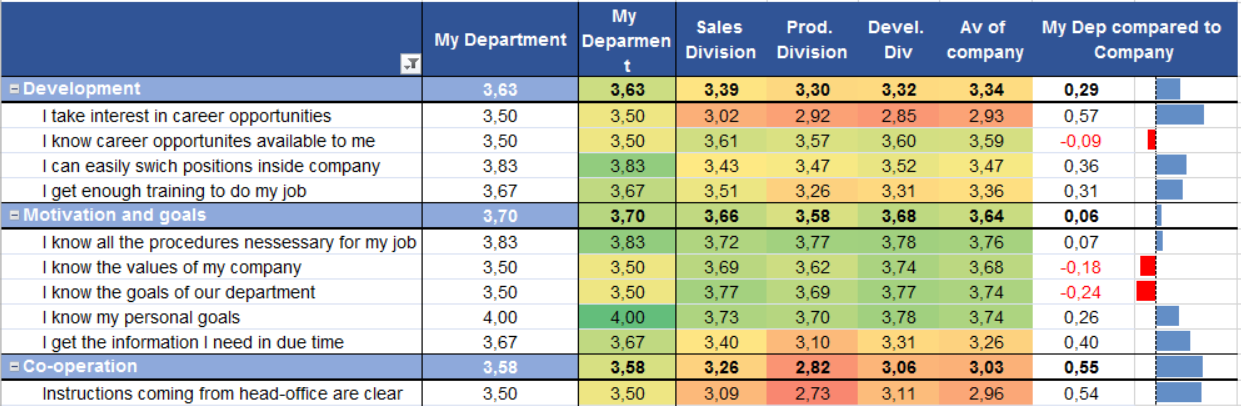
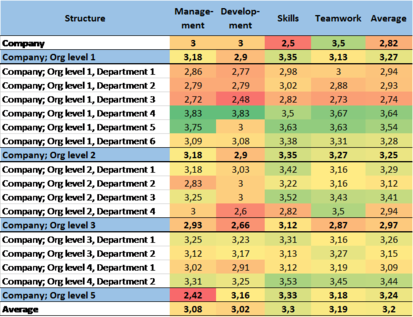
We often use the so-called “heat map” method to quickly and clearly present deflections in statistics. The heat maps - based on colors - help to visually detect on average lower and higher results. The heat map views conform based on pre-submitted data. The views can be used for comparing department results, evaluations given by managers. Below is an example of calibration of managers’ evaluations (helps to understand which managers are on average more strict in their evaluations).
In most HR surveys comparisons per
competency level can be presented. These comparisons can be used for 360 degree
surveys and performance appraisals. In addition to showing the general
competency level in
competency level surveys it is possible to compare departments and markets.
The attention people give to questions in 360 degree surveys or performance appraisals differ. Upsteem.com’s survey module enables adding comments to scalar questions. Voluntary comments and the majority of them can be significant in analyzing results. E.g. it is possible to understand in which areas the employees feel at home and what gets them going.
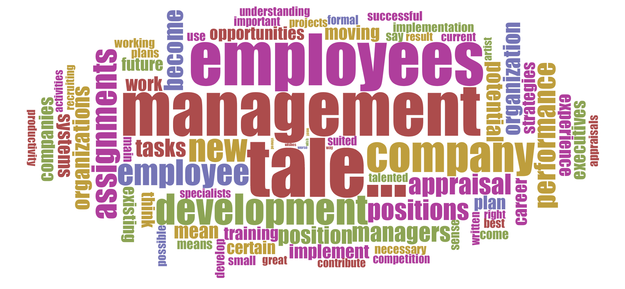
In
the free text analysis we use word cloud tools which enable emphasizing statistically
repeating words in huge volume texts. This enables quickly realizing which
issues are important in the ongoing evaluation process or performance
appraisal. One tool for this is Vyant-Tools (http://voyant-tools.org/).
 -->
-->